

A bird’s eye view for Wi-Fi – Enabling business partners to assess Wi-Fi networks remotely
eero (Amazon’s Wi-Fi company) collaborates with Internet Service Providers to deploy eero routers to end-customers. When customers contacted their ISP about problems, support agents found it difficult to resolve hardware issues virtually. I encouraged our team to build a topological map of the customer’s space, so they could easily identify both physical and connection issues.
Timeline
Apr-Aug 2022 (5 months)
Results
Reduced the average duration of support calls by 3-5 minutes across ISP partners
Role
Sole UX designer in a 8-person team
Responsibilities
I led the product vision and led the initial designs, from working with our business partners to getting leadership approval.
Customer Context - B2B to B2COur business partners
Internet Service Providers (ISPs) buy our eero Wi-Fi routers and services to sell to end-customers.

End-customers
End-customers are the users who engage with the products sold by Internet Service Providers (ISPs).

Product Challenge Remotely resolving physical Wi-Fi issues was cumbersome to Internet Service Providers and their support agents.
In 2020, eero started to partner up with Internet Service Providers (ISPs) to deploy eero routers to end-customers. This new partnership led a growth to the ISPs’ business, but it also put a strain on their customer support teams. Agents found fixing Wi-Fi network virtually was difficult without seeing the actual hardware in the customer’s home.
Product Solution We built a topological map, a virtual view of the customer’s Wi-Fi setup, for agents to better resolve physical issues.
Prior to introducing the topological map, Internet Service Providers dispatched technicians to assist customers struggling with Wi-Fi network setup, a costly and non-scalable approach. Drawing inspiration from user-centric products like Google Maps, which immerse you in the user's experience, I developed a product for ISPs to seamlessly step into their customers' environments.

Product Deep DiveA lot of agents are visual learners, so having a list view of the customer’s Wi-Fi setup was difficult for them to retain information.

Issue #1Disconnected Wi-Fi view - Agents couldn’t see how devices (i.e. laptop) were interacting with the routers.

Issue #2 Text-heavy - Agents couldn’t see how routers were communicating with each other, only individual statuses.

Issue #3 Too simplified - Even if a Wi-Fi network is online and running, a router hardware may have issues. A deeper dive into the Wi-Fi performance would be more valuable.
Instead of requiring ISPs to take notes and mentally troubleshoot, I suggested the idea of a topological map to reduce cognitive load.
From the start, I worked with engineering to discuss the types of view to design for our ISPs. Topological maps came in many forms, but we gravitated towards the diagrams engineering had access to in their database. We wanted to move fast and gain momentum at the beginning.

I workshopped designs with engineering to map out required components and created a demo to get early feedback from leadership.
At a high-level, the goal was to display the user’s the physical routers and personal devices. Using simple shapes to convey my concept, engineering efficiently translated my designs into code, transforming them into an interactive interface. This was helpful to get early feedback from leadership and ISPs.

We opted in for outlined visuals over rendering because they loaded faster, elevating the overall experience of the customer call.
I explored different visual options in representing the user’s eero routers and their connection to personal devices. We moved forward with using vector visuals, because engineering confirmed they’re is less likely to lag.

Initial Iteration - Wild approachRendered visuals: Accurately represents how the user’s routers look like in real life, however, rendering them was costly and created lag when loading.
Proposed Iteration - Mild approachVector visuals: The visual components were adapted from the eero app for consistency and familiarity.
Based on early feedback from engineering, I pivoted from using organic lines to angular lines because it contributed to a cleaner codebase.
Initially, I used organic lines to represent the connection between routers, instead of straight lines because the latter looked stiff. The organic lines were meant to indicate to the ISP the components were interactive. However, because calculations were required to ensure a cleaner codebase, we pivoted to angular lines.

Angular (Proposed concept) - Although it looks stiffer, this concept ensured a cleaner codebase.

Organic (Alternate concept) - Looks more interactive, but difficult to define the organic behavior.
By organizing the topology map in some sort of structure, ISPs were able to read 2x faster and more accurately.
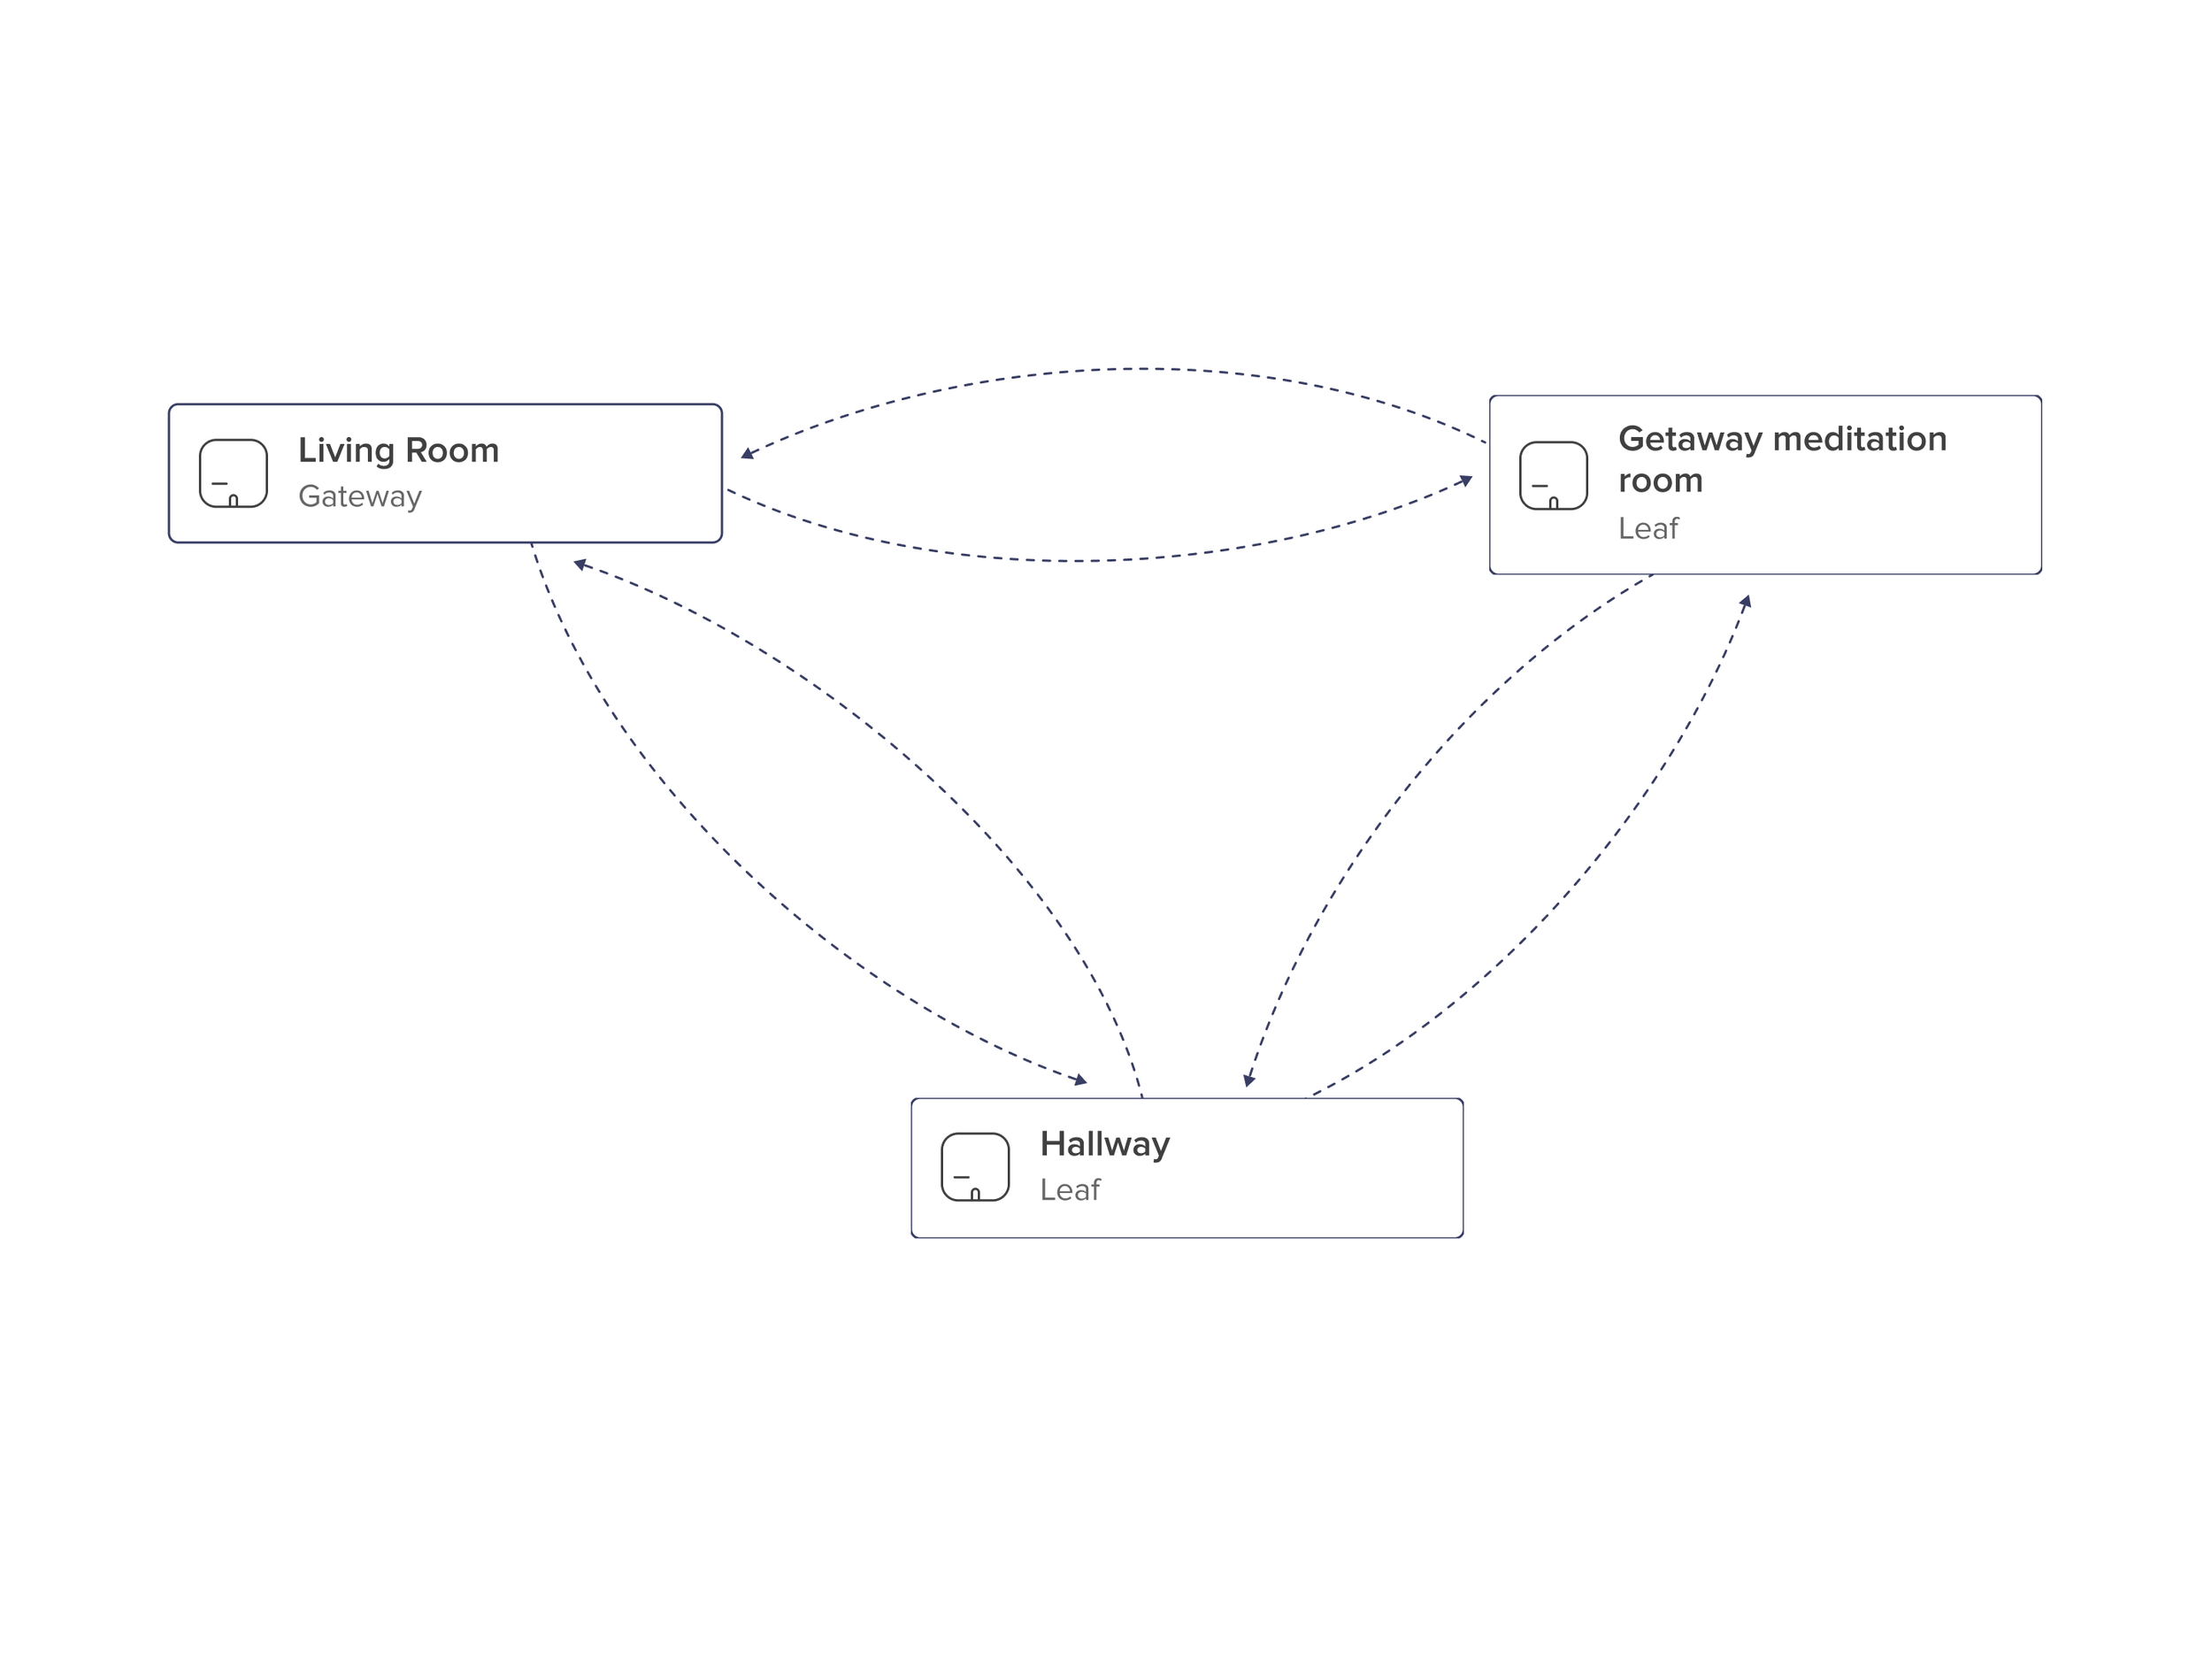
Initially, the topology map was focused on showing the distance between routers (distance impacts Wi-Fi signal strength), creating a flowchart-like diagram. But ISP agents felt it looked scattered and confused where to start looking. Later, I pivoted towards a layout that scaled more cleanly

Initial IterationFlowchart layout: Contextual and informative for ISPs to identify weak Wi-Fi signal due to distance between routers and devices. The main drawback is it’s not scalable.

Proposed IterationHierarchical layout: Clean and structured for ISPs to scan and troubleshoot. It scales better when dealing with larger Wi-Fi networks.
For a connected experience, the dual view allowed ISP agents to see both a bird’s eye view and detailed view of a customer’s Wi-Fi setup.
Adding a visual diagram to eero Insight was new to the team, so I brainstormed an infrastructure where ISPs can view the communication (the sending and receiving of Wi-Fi signals) between a router and a device.

Initial IterationFull view: The entire content moves together when the viewport is zoomed in or out, but ISP agents find themselves needing to repeatedly zoom in and out to view details for multiple devices.

Secondary IterationModal view: ISP agents don’t have to leave the main page, but content feels crammed and requires an extra tap to pull up the viewport.

Proposed IterationSidebar view: Despite the reduced vertical space, this structure enables ISP agents to seamlessly zoom in and out of the topology map while accessing additional content
ISP agents didn’t have a quick view of the impact affecting a customer’s Wi-Fi network.
To help ISP agents address hidden issues, I worked on an interactive component that enabled agents to skim visible events across a 24 hour time frame.

Initial IterationBuilding structure: Viewing the timeline in a 6-hour interval helped organize a large set of events.

Second IterationLeveraging color: Simplifying and color-coding which timeframe had the most critical issues help guide the ISP agents.

Third IterationMaximizing space: Reducing repetitive text helped ease clutter.
Final iteration

Designating a page on eero Insight for the topology map encouraged feature usage by ISP agents.
Our team’s findings, derived from 3 rounds of usability testing involving 15 participants, reveal that users didn’t feel the topoplogy map was as important when displayed as a button on an existing page or a hyperlink. Adding an etry point from the menu bar was the strongest factor in improving the perception of this feature’s value.

After launching our MVP, we reduced the average duration of support calls by 3-5 minutes across ISP partners.
ISP support agents, who are visual learners, can now piece a customer’s Wi-Fi setup together when resolving an issue virtually. The topology map alleviates the cognitive load associated with recalling minor issues that collectively contribute to larger problems.


Credits
Thanks to other contributors: Dean Mercado (Engineering), Michael Swingler (Design) and Owen Whiting (Design) for contributing to the later stages of the topology map.